CRUCIBLE · PREDICTION HYPOTHESES
"use data A to predict Z over time T, then automate" — 10 candidates, honest odds · Jun 09, 2026 04:07 UTC
First, the uncomfortable truth about searching for formulas
Your intuition — the world is full of chain reactions, so search long enough and you'll find formulas that work —
is half right, and the wrong half is the expensive one.
Right: reality has structure, and real predictive relationships exist.
Wrong: "search long enough and you'll surely find winners." You'll surely find things that fit the past perfectly — and most are coincidences. With enough formulas you are mathematically guaranteed to find ones that look brilliant on history and fail on the future. That's not a flaw in the search; it's the reason the gate exists.
Three things stand between a true relationship and your bank account:
1. Markets already price what's known. The predictable, deterministic part is in the price. You need a relationship others haven't found, can't act on, or that's structurally forced (flows).
2. The search manufactures false winners. Determinism doesn't help if you can't tell the one real formula from the 10,000 spurious ones that fit the same past — and from the past alone, you can't, without trial-count discipline.
3. Markets are reflexive. Find a real edge, trade it, and you (and everyone else who found it) arbitrage it away.
So searching is necessary — but the search is the danger, not the solution. Below are 10 real, named candidates. The ones with structural reasons to persist (forced flows, slow-diffusing info, risk premia) are the bets; pure "fit a curve to price" ones are the traps. Every one would face the same four gates.
Right: reality has structure, and real predictive relationships exist.
Wrong: "search long enough and you'll surely find winners." You'll surely find things that fit the past perfectly — and most are coincidences. With enough formulas you are mathematically guaranteed to find ones that look brilliant on history and fail on the future. That's not a flaw in the search; it's the reason the gate exists.
Three things stand between a true relationship and your bank account:
1. Markets already price what's known. The predictable, deterministic part is in the price. You need a relationship others haven't found, can't act on, or that's structurally forced (flows).
2. The search manufactures false winners. Determinism doesn't help if you can't tell the one real formula from the 10,000 spurious ones that fit the same past — and from the past alone, you can't, without trial-count discipline.
3. Markets are reflexive. Find a real edge, trade it, and you (and everyone else who found it) arbitrage it away.
So searching is necessary — but the search is the danger, not the solution. Below are 10 real, named candidates. The ones with structural reasons to persist (forced flows, slow-diffusing info, risk premia) are the bets; pure "fit a curve to price" ones are the traps. Every one would face the same four gates.
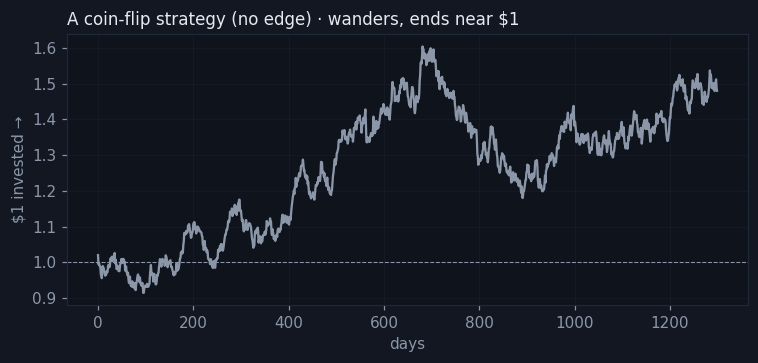
How to read these graphs
Every equity curve here answers one question: "if I'd put $1 in on the start date, what would it be worth now?"
Up-and-to-the-right means the strategy made money over that window; flat means no edge; a cliff means a blow-up.
(The crypto charts start ~2021 because that's where the free data begins — it is NOT a cherry-picked date.)
The 10 hypotheses
Earnings-surprise drift (PEAD)
DECENT ODDSsignal A = a company's quarterly earnings vs. analyst estimate (the 'surprise')
predict Z = that stock keeps drifting in the surprise's direction
horizon T = 30–60 days
Investors under-react to news; the price catches up over weeks. One of the oldest documented anomalies.
honest read: Real and decades-old, but crowded and decayed. Free-ish (SEC EDGAR + estimates).
no chart yet: no free data — needs paid analyst estimates
Insider-buying clusters
DECENT ODDSsignal A = SEC Form 4 filings — when multiple insiders BUY their own stock
predict Z = positive stock returns
horizon T = 1–6 months
Insiders know more than you; several buying at once is a conviction signal.
honest read: Documented edge; needs filtering (routine vs. real). Free (SEC EDGAR).
no chart yet: buildable free (SEC EDGAR Form 4) — not yet wired
Index-inclusion front-run
LONG SHOTsignal A = announcement a stock will be ADDED to the S&P 500 / a major index
predict Z = price pops before the index funds are forced to buy
horizon T = days to weeks
Trillions in index funds MUST buy on inclusion day — forced, predictable flow.
honest read: Well-known and front-run; the effect has shrunk. Free (announcements).
no chart yet: no free historical add/remove list
Weather → energy
LONG SHOTsignal A = temperature forecasts (heating/cooling degree days)
predict Z = natural-gas & power demand and price
horizon T = days
A cold snap forces heating demand — a literal physical chain reaction.
honest read: Real chain, but energy desks/pros dominate it. Free (NOAA).
no chart yet: buildable free (NOAA weather + FRED natgas) — not yet wired
Cross-asset lead-lag
LONG SHOTsignal A,B = returns of a 'leader' (e.g. copper, oil, BTC) that moves first
predict Z = the laggard's return (equities, alt-coins)
horizon T = hours to days
Information diffuses unevenly; fast assets lead slow ones until everyone catches up.
honest read: Persistent only in slow, illiquid corners; fast-arbitraged elsewhere. Free.
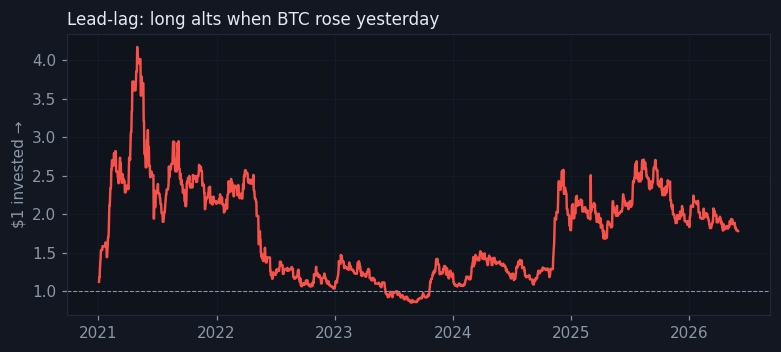
tested on real data: DIES · honest Sharpe 0.322, OOS 0.639, DSR 0.7328
Attention → retail flows
DECENT ODDSsignal A = Google Trends / social-media volume for a ticker or coin
predict Z = short-term momentum from retail piling in
horizon T = days
Attention precedes retail buying, especially in meme stocks and crypto.
honest read: Works best in retail-driven names; lookahead/point-in-time traps. Free-ish.
no chart yet: Google Trends — flaky API + lookahead/rescaling traps
Positioning extremes → reversal
DECENT ODDSsignal A,B = perp funding rate + long/short ratio + open interest
predict Z = mean-reversion when the crowd is dangerously one-sided
horizon T = days
Over-crowded leveraged trades get liquidated and snap back — a structural unwind.
honest read: Structural and free (Binance); the contrarian-to-extremes version is the real one.
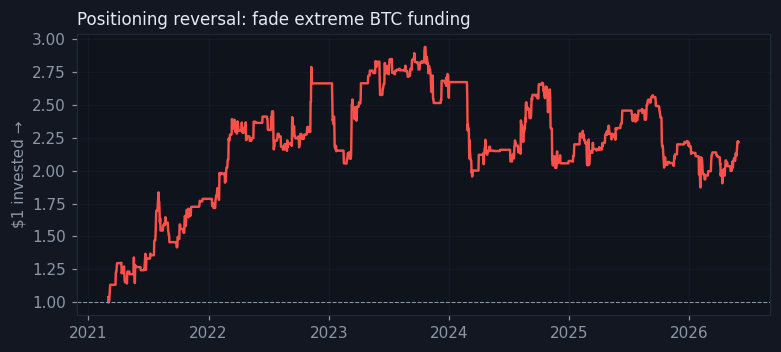
tested on real data: DIES · honest Sharpe 0.942, OOS -0.192, DSR 0.9681
Macro liquidity regime
LONG SHOTsignal A,B,C = yield-curve slope + real rates + money/stablecoin supply growth
predict Z = risk-on vs. risk-off for stocks & crypto
horizon T = weeks to months
Liquidity is the tide that lifts or sinks all risk assets.
honest read: Slow, regime-dependent — our stablecoin nowcast was exactly this, and only marginal. Free (FRED).
no chart yet: ≈ the stablecoin nowcast we ran: marginal, regime-dependent
Sports closing-line value
DECENT ODDSsignal A,B = how a betting line moves from open to close + the sharpest book's price
predict Z = which side is +EV / the game outcome
horizon T = per game
Sharp money moves lines toward true probability; consistently beating the closing line = long-run profit.
honest read: A real, measurable edge — but books LIMIT/ban winners, which kills automation. Free-ish.
no chart yet: no free historical closing lines
Alt-data nowcast
DECENT ODDSsignal A = a company's hiring (job postings), web traffic, or app-store rank
predict Z = its next revenue surprise → the stock
horizon T = weeks to a quarter
Real-time operational data reveals the business before the earnings report does.
honest read: Real (your job-postings instinct); the good datasets are usually paid.
no chart yet: datasets are paid (Revelio / Thinknum)